
SDG2: Zero Hunger
Assessing progress towards sustainable cropping systems: the case of China(2019)
Scale: National
Study area: China
Developing agriculture to ensure long-term food supply contributing to economic and social development, while minimizing environmental impacts is at the heart of the challenge. Quantitatively assessing the sustainability of agricultural systems is therefore critical and requires spatial and temporal monitoring of three key aspects, economic,environmental, and social, and examining the interactions between them. This is a complex undertaking and requires innovative data infrastructure such as the Big Earth Data infrastructure that provides one of the best implementations to accomplish this task.
Target 2.4: By 2030, ensure sustainable food production systems and implement resilient agricultural practices that increase productivity and production, that help maintain ecosystems, that strengthen capacity for adaptation to climate change, extreme weather, drought, flooding, and other disasters, and that progressively improve land and soil quality.
Indicator 2.4.1: Proportion of agricultural area under productive and sustainable agriculture.
Method
By integrating remote sensing methodologies, spatial allocation models, global crop water models, and mass balance models, analysis estimates three sub-indicators of SDG 2.4.1— land productivity, water use (represented by irrigation water consumption), and fertilizer pollution risk (represented by excess nitrogen and phosphrous)—for China from 1987 to 2015. The sub-indicators were calculated for a total of 14 major crops, over 76% of the harvest area in China that accounts for about 87% of kilocalorie production in the region.
“Environmental intensity”—environmental impacts per kilocalorie produced—was used to develop a matrix to determine level of sustainability, to facilitate comparison among different agricultural zones and across indicators. Sustainability criteria were proposed according to the definition from the FAO’s metadata for SDG 2.4.1, which is based on two aspects: current state and trends. A decrease in intensity suggests a more sustainable level. The trends of each sub-indicator and the integrative patterns in terms of environmental intensity were estimated for the entire study area.
Data used in this case
For this study the Big Earth Datasets are composed of the 1:100,000 National Land use/cover Database of China based on Landsat, China-Brazil Earth Resources satellite (CBERS) and HJ-1 satellite data; MODIS time series vegetation index data; statistical data including national crop harvest area and yield, irrigation area, and fertilizer application; field survey data including pollution census data and agricultural census data; and information on crop phenology and fertilizer application rate obtained from literature.
Results and analysis
The study found that from 1987-2015, environmental intensity for land use (-43%), irrigation water consumption (-30%), and excess N application (-24%) decreased whereas excess P application (+66%) increased. However, all indicators declined after 2000. Collectively, the intensity of all four indicators declined across 26% of cropland, meaning that these croplands had achieved at least an acceptable level of sustainability across the four indicators. Environmental intensity was found to have increased in only 3% of cropland for all four indicators collectively. Generally, regions with lower land intensity had greater improvement across all other indicators. Overall these results suggest that China’s food supply has become more environmentally efficient over time.
Recognizing drivers of change in sustainability helps develop future strategies. Analysis indicates that farm management explained >90% of changes in crop production and environmental impacts. Precision agricultural management, such as Science Technology Backyard platforms, has helped China’s cropping systems to become more sustainable.
Meanwhile, nationwide loss of fertile cropland to urban expansion was offset by cropland expansion in arid and low- productivity northern regions, where land and irrigation water intensity were much higher than the national average. Continued spatial redistribution of croplands, which was already observed, may further challenge China’s food security. Coordinating land- use change and farm management are thus critical for delivering agricultural sustainability in China, and also other rapidly urbanizing regions of the world.
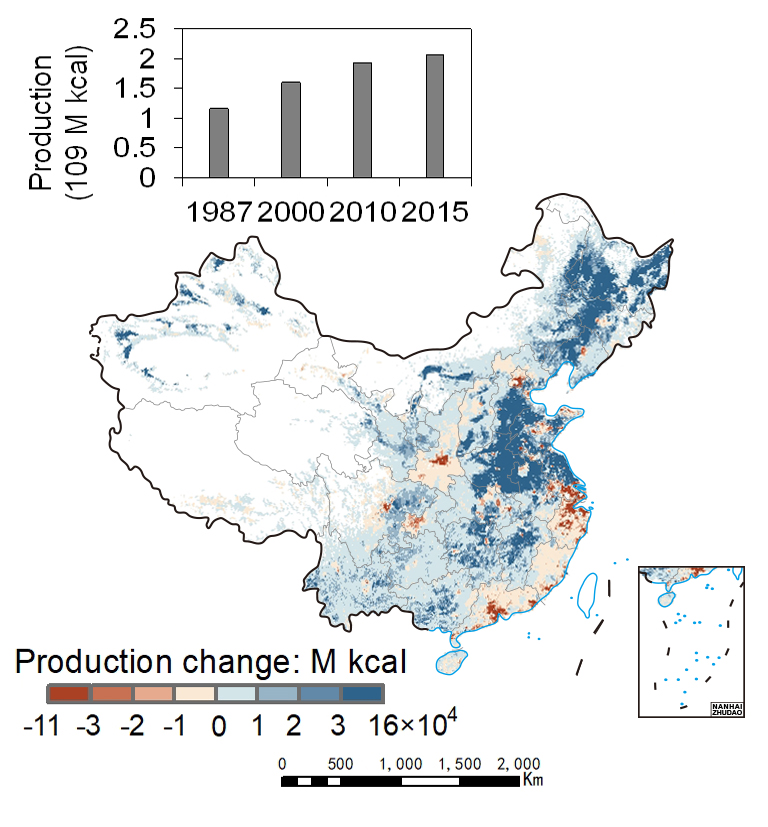

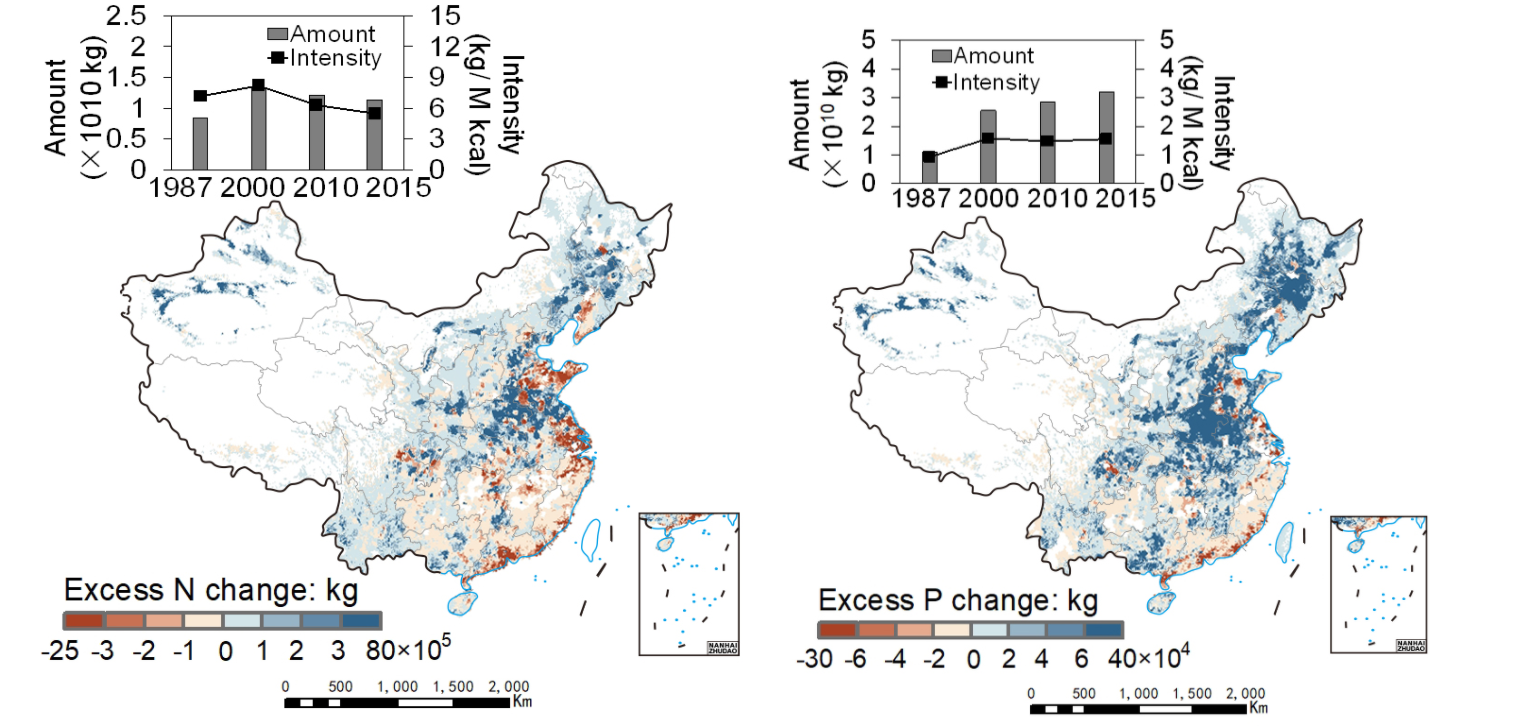
Figure 1. Spatial distribution of changes in crop kilocalorie production (a), cropland area (b), irrigation water (c), excess N use (d), and excess P use (e) from 1987 to 2015 in China. Inset plots indicate the changes in amount (A) and intensity (I) for these indicators in 1987, 2000, 2010, and 2015 (data for Taiwan province is missing).
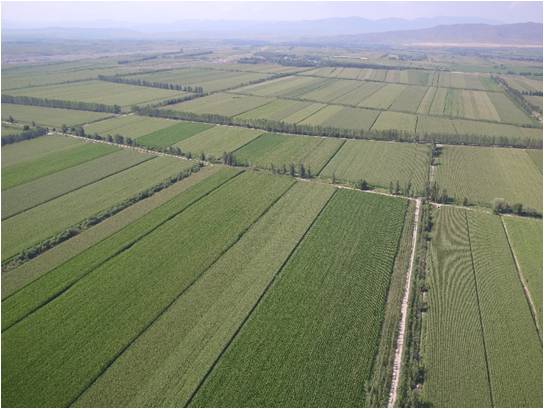
Figure 2. High-standard cropland in Xinjiang Uygur Autonomous Region of China.
| Highlights |
For the period of 1987-2015, about one quarter of croplands in China improved in efficiency in terms of land use, irrigation water consumption, and excess fertilizer application; since 2000, national average intensity of all three indicators decreased, indicating a more environmentally efficient cropping system in China. Farm management explained >90% of the changes; meanwhile, land-use change primarily driven by urbanization challenged the trends. Coordinating land-use change and farm management are critical for delivering agricultural sustainability in China and other rapidly urbanizing regions of the world. |
Outlook
Applying the above methodologies in other countries, especially those countries along the Belt and Road, which has a high population density with high food scarcity, can help to gradually improve the efficiency of their productivity and move towards a more sustainable cropping system.
Further employing Earth observation technology in the estimation of other sub-indicators, and exploring methodologies for fusing social and economic data with Earth observation data,will help develop mechanisms to coordinate different sources of data in the estimation.
Exploring interconnections between SDG 2.4.1 and other indicators particularly in SDG 6, SDG 11, SDG 13, will provide improved understanding of how different goals influence each other and provide valuable insights on underlying factors locally, helping to promote region-specific strategies toward sustainability and to support decision making.