
SDG11: Sustainable Cities and Communities
Integrated assessment of SDG 11 indicators at the provincial scale in China(2020)
Target: 11.2 By 2030, provide access to safe, affordable, accessible and sustainable transport systems for all, improving road safety, notably by expanding public transport, with special attention to the needs of those in vulnerable situations, women, children, persons with disabilities and older persons.
11.3 By 2030, enhance inclusive and sustainable urbanization and capacity for participatory, integrated and sustainable human settlement planning and management in all countries.
11.5 By 2030, significantly reduce the number of deaths and the number of people affected and substantially decrease the direct economic losses relative to global gross domestic product caused by disasters, including water-related disasters, with a focus on protecting the poor and people in vulnerable situations.
11.6 By 2030, reduce the adverse per capita environmental impact of cities, including by paying special attention to air quality and municipal and other waste management.
11.7 By 2030, provide universal access to safe, inclusive and accessible, green and public spaces, in particular for women and children, older persons and persons with disabilities.
| Highlights |
| The first integrated assessment was undertaken at the provincial scale of the five targets and seven indicators under SDG 11 by utilizing Big Earth Data and national statistical data. Compared with 2015, overall sustainability improved in 2018 at the provincial level. The SDG 11 integrated index was higher in the eastern provinces than in the western ones. It increased in 28 provinces but decreased in 3 others. The average value of SDG 11 integrated index increased from 0.58 in 2015 to 0.65 in 2018. |
Background
The Sustainable Development Solutions Network (SDSN) calculated the integrated index of the 17 SDGs for each country in the world using an equal weight method (Sachs et al., 2019). Xu et al. (2020) used the same approach to calculate the index for each provincial-level administrative region of China. Based on data availability, this work focused on the five targets and seven indicators under SDG 11 and made integrated assessment of SDG 11 at the provincial-level scale through comparison between 2015 and 2018. Furthermore, for each province, the key targets and indicators were identified, where special attention is required in order for SDGs to be achieved by 2030.
Data used
①Public transportation information data of China.
②Data product of ratio of land consumption rate to population growth rate.
③Hazard data from China's statistical yearbooks.
④City statistical yearbooks of China.
⑤Annual average PM2.5.
⑥Land use/land cover data.
⑦Gridded population data.
⑧Public spaces in Chinese urban built-up areas.
Method
1) Normalization
In order to eliminate residuals caused by different dimensions, self-variation or extreme values of indicators, it is necessary to standardize the original indicators between 0 and 1 with the following equation:
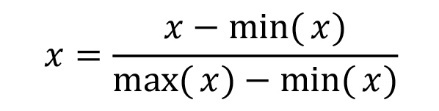
A value of the normalized indicators closer to 0 indicates a worse performance while a value closer to 1 indicates a better performance. To remove the effects of extreme values, data at the bottom 2.5th percentile were selected as the lower bound for normalization, which is put forward by Organisation for Economic Co-operation and Development (OECD) and JRC. The selection of the upper bound drew on the method from the Sustainable Development Report 2019 (Sachs et al., 2019) and Xu et al. (2020).
2) Calculation of the integrated index
The following equation was used to calculate the integrated index according to the method in the 2019 Sustainable Development report (Lafortune et al., 2018):
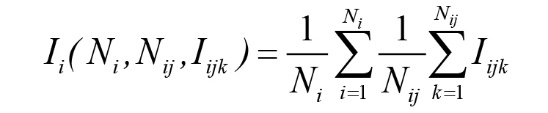
where Ii is SDG 11 integrated index of province i; Ni indicates the number of targets of province i; Nij denotes the number of indicators of targets j of province i; Nijk is the value of indicators of targets j of province i.
3) Quantifying the level of achievement of targets
To assess the progress on a particular target at the provincial level, an SDG 11 dashboard was generated, with the indicators divided into four levels (green, yellow, orange and red) (Lafortune et al., 2018). Green is the upper bound of each indicator. The colors yellow, orange and red represent distances to achieving SDG 11. Red denotes the lower bound of each indicator. The upper and lower bounds are the same as for the normalization of the integrated index.
Results and analysis
1) SDG 11 integrated index
Figure 1 shows the spatial distribution of SDG 11 integrated index at the provincial scale. In general, the integrated index was higher in the eastern provinces than in the western ones. It went up in 28 provinces and down in 3 provinces in 2018 compared with 2015, with its average value increasing from 0.58 to 0.65. The number of provinces with an integrated index value below 0.6 decreased from 20 to 8, while the number of those above 0.68 increased from 8 to 10.
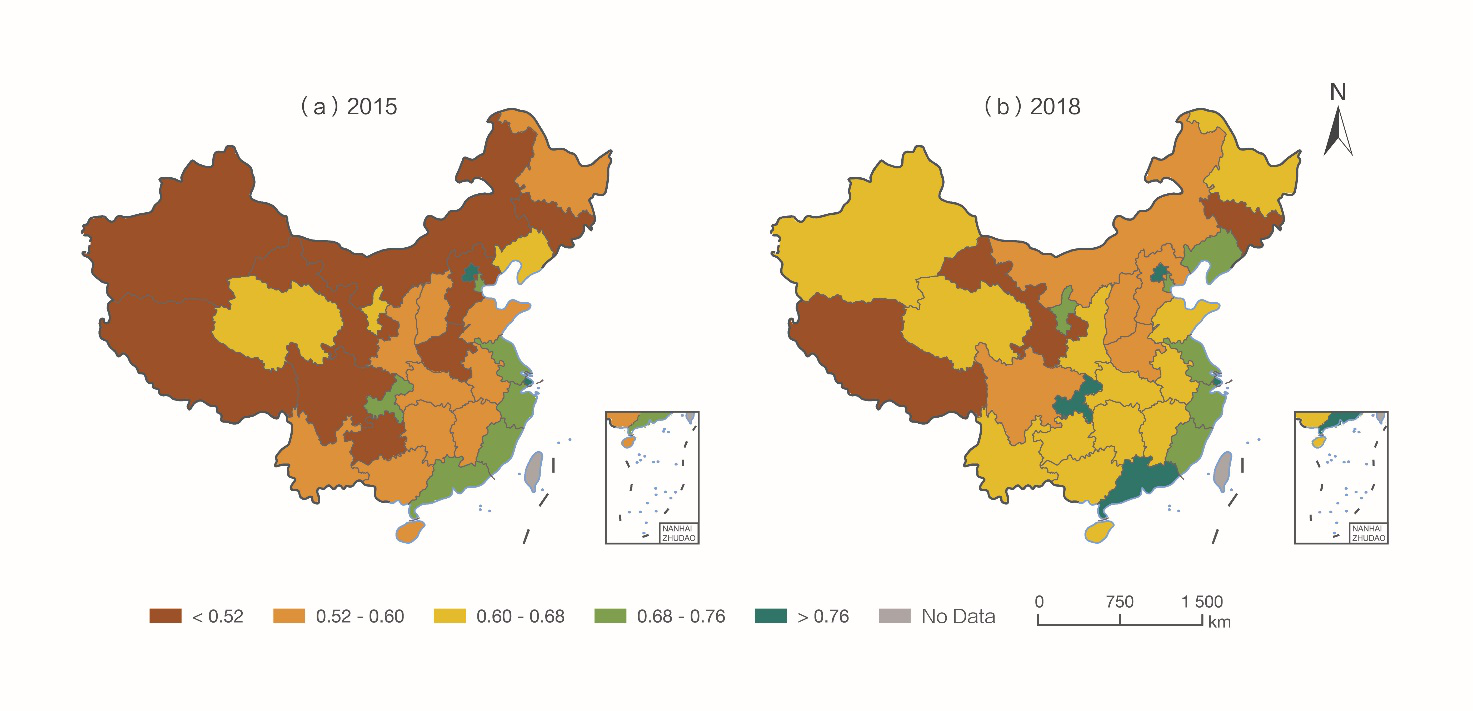
Figure 1. The spatial distribution of SDG 11 integrated index at the provincial scale
2) Progress in sustainable development targets
Figure 2 shows the SDG 11 dashboard at the provincial scale in China from 2015 to 2018. On the whole, good progress was made in achieving SDG 11.3, while more effort was needed to achieve SDG 11.6. Specifically, eastern provinces were closer to realizing SDG 11.2 and 11.3, while the central and western provinces were still further from realizing SDG 11.5. The provincial governments, while keeping up efforts on targets where good progress is made, should pay more attention to those targets where progress is lacking.
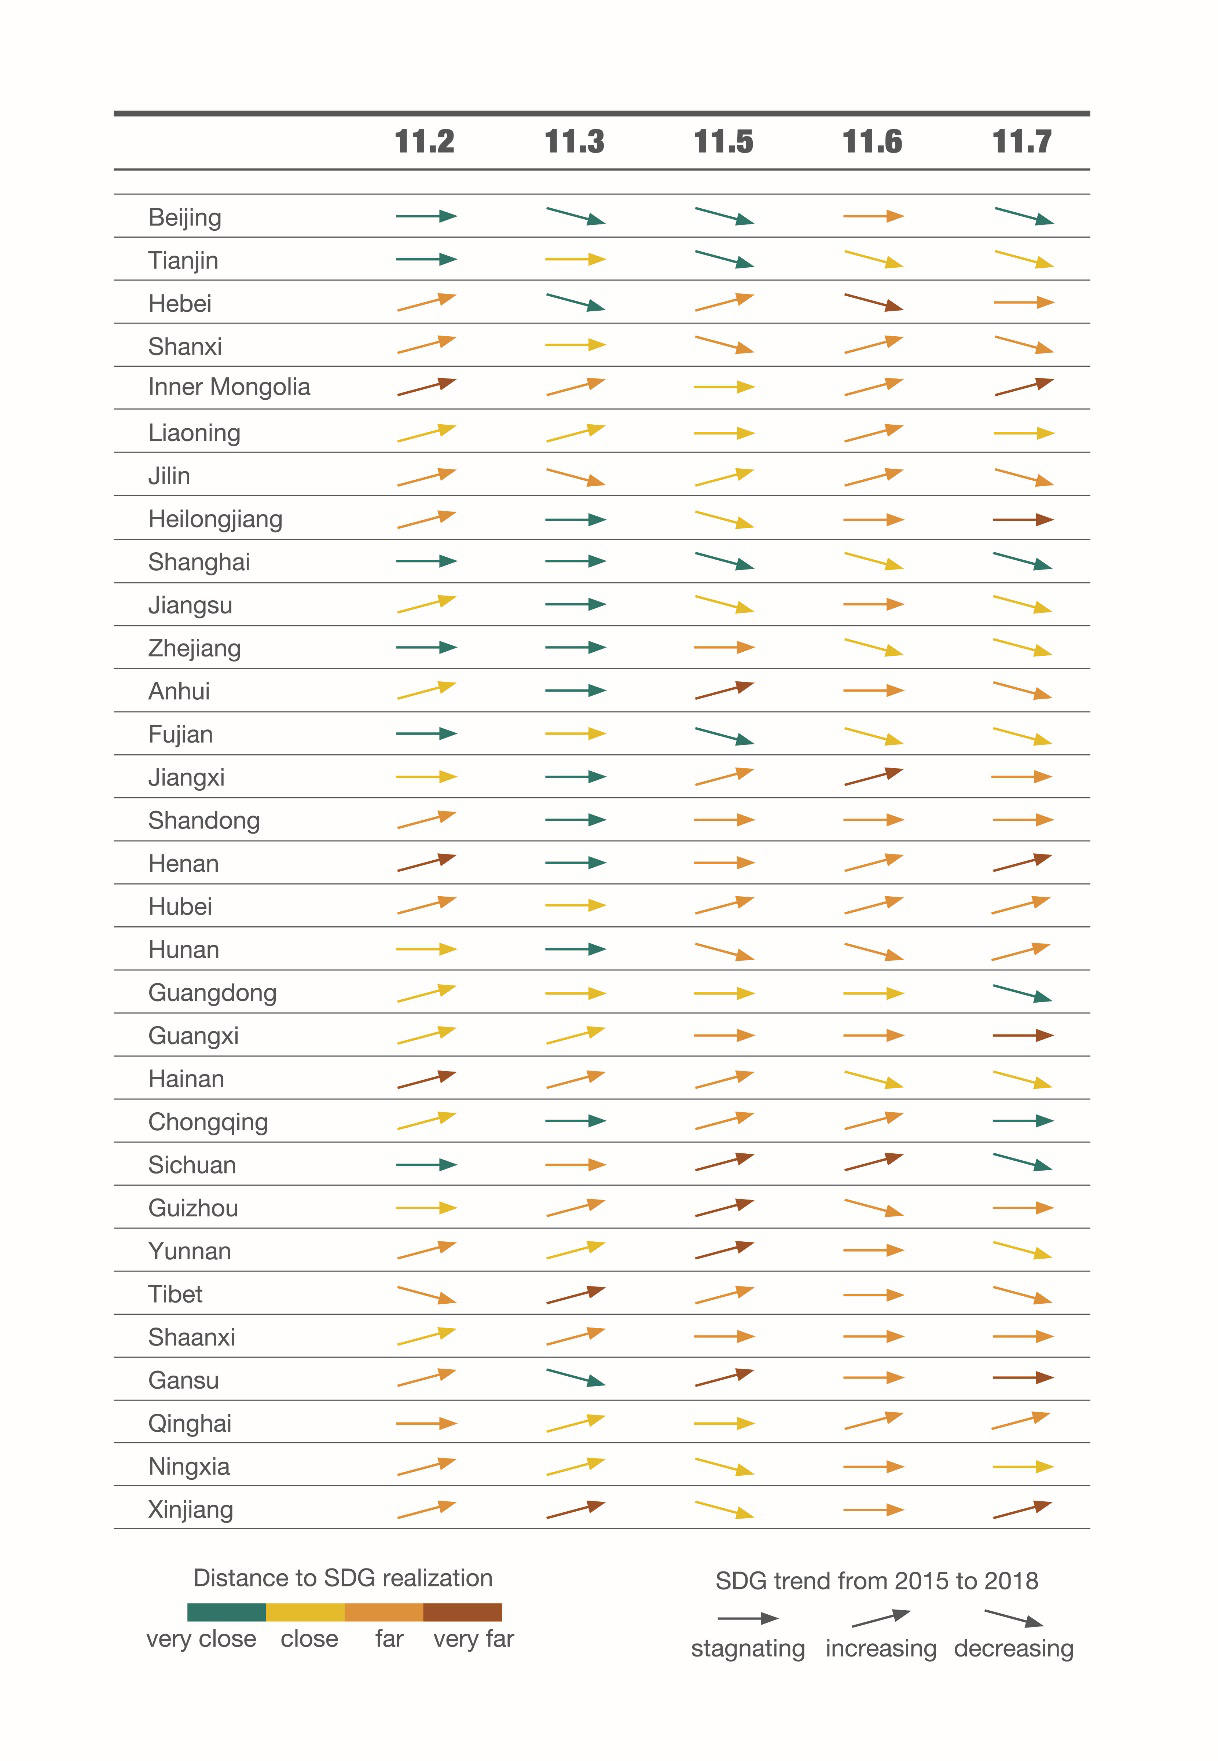
Figure 2. SDG 11 dashboard
Outlook
In this case, the SDG 11 integrated index was calculated using the method of SDSN in the 2019 Sustainable Development Report, which can serve as a tool for the evaluation of the sustainability of SDG 11. Whether each province performed well or not in achieving SDG 11 is clearly indicated by the value of each indicator and on the dashboard. Indicators and targets under SDG 11 can impact each other, and no indicator should be achieved at the expense of another. Therefore, the interactions between indicators should be studied in the future.