
SDG11: Sustainable Cities and Communities
Monitoring and assessing urbanization progress in China(2020)
Target: 11.3 By 2030, enhance inclusive and sustainable urbanization and capacity for participatory, integrated, and sustainable human settlement planning and management in all countries.
| Highlights |
| Impervious surface products of 433 Chinese cities with a population over 300 000 from 1990 to 2018 were independently created. A new indicator—the ratio of Economic Growth Rate to Land Consumption Rate (EGRLCR)—is proposed, as an expansion of SDG 11.3.1, to monitor and evaluate urbanization progress in China tri-dimensionally in terms of land, population, and economic development. Since 1990, the rise in the ratio of Land Consumption Rate to Population Growth Rate (LCRPGR) had been accompanied by a decline in EGRLCR; the value of LCRPGR rose from 1.33 between 1990 to 1995 to 2.15 between 2010 to 2015; after 2015, the expansion of urban built-up areas has been slowing down, but coordinated development of urbanization still faces challenges. |
Background
SDG 11.3.1—"the ratio of Land Consumption Rate to Population Growth Rate (LCRPGR)" —can be used to quantify the relation between spatial urban expansion and population growth. According to United Nations statistics, between 2000 and 2014, the rate of land consumption in urban areas was 1.28 times that of population growth (UN, 2019). The relation of these two rates is essential to the sustainability of cities. Given that SDG 11.3.1 is classified as a Tier II indicator (methods established but with poor data) and lacks the economic dimension, it cannot measure, in a comprehensive way, the degree of coordination among land, population and economic activities during urbanization. On that account, Big Earth Data can be instrumental in assessing the urbanization progress in China from the environmental, social, and economic perspectives and in improving the accuracy and scientific soundness of the assessments (Guo, 2019).
Data used
Population data of 433 Chinese cities with over 300 000 urban inhabitants from 1990 to 2018 (1990, 1995, 2000, 2005, 2010, 2015 and 2018) retrieved from the 2018 Revision of World Urbanization Prospects (UN, 2018).
Global urban impervious surface products with a resolution of 30 m from 1990 to 2010 (1990, 1995, 2000, 2005 and 2010) and with a resolution of 10 m in 2015 and 2018.
Population and Gross Domestic Product (GDP) data derived from the Chinese Urban Statistical Yearbook and China Statistical Yearbook from 1990 to 2018 (1990, 1995, 2000, 2005, 2010, 2015 and 2018).
Method
Following UN terms (UN, 2019), urban impervious surface was converted to built-up area. Based on LCRPGR, a new indicator was proposed—the ratio of Economic Growth Rate to Land Consumption Rate (EGRLCR). The two indicators were computed as follows:
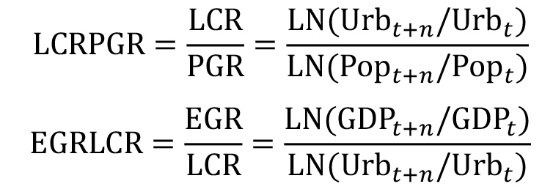
where Urbt and Urbt+n are the total areal extent of the land consumed (extent of urban agglomeration area quantified as built-up area) at the initial reference year t, and at the final reference year t+n, respectively; Popt and Popt+n are the total population of the specific spatial unit at the initial reference year t, and at the final reference year t+n, respectively; GDPt and GDPt+n are the total amount of GDP of the specific spatial unit at the initial reference year t and at the final reference year t+n, respectively; LN refers to the natural logarithm of the ratio. LCR, PGR and EGR are the land consumption, population and economic growth rates between t and t+n, respectively.
The values of LCRPGR and EGRLCR were calculated to measure the level of coordination among land consumption, population and economic growth in 433 cities of different urban sizes and functions and shed light on the spatiotemporal evolution of urbanization in China in the past three decades.
Results and analysis
Figure 1 shows the urbanization process in China measured in terms of changes in LCRPGR and EGRLCR of 433 county-level or higher cities. Along with the overwhelming spatial expansion coupled with a continuous slowdown in population and economic growth in urban areas, LCRPGR rose, while EGRLCR declined from 1990 to 2015, suggesting poor coordination among urbanization indicators in China. Thanks to a series of measures implemented by governments at all levels aimed at improving the quality of urbanization, such as the "National New Urbanization Program (2014-2020)", there has been a notable decrease in the areal extent of new urban land since 2015, reversing the trend where LCR had long exceeded PGR, and even been approaching EGR.
The patterns and dynamics of LCRPGR in China over the past several decades are shown in Figure 2. The study found that the rapid expansion of urban built-up areas has been effectively controlled since 2015, but the sustainability of urbanization is still under pressure. LCRPGR showed an upward trend in the northeastern and western regions, and remained relatively stable in the central and eastern regions; while it was fairly stable in megacities (with a population above 10 million), it was significantly higher, during multiple time periods, in super-large cities (with a population between 5-10 million) than cities in other categories; for resource-dependent cities, LCRPGR exceeded that of non-resource-dependent cities in most time periods at five-year intervals. These findings suggest that urbanization is more out of balance in super-large cities and resource-dependent cities in the northeastern and western regions and it deserves special attention.
The spatiotemporal evolution in EGRLCR of Chinese cities shows that the gap between land consumption rate and economic growth rate has been narrowing, but imbalances remain between land consumption, population and economic growth rate. EGRLCR of resource-dependent cities is on a significantly downward trend, while it only fluctuates slightly in the eastern region; in megacities, the indicator is more stable than in cities of other sizes; it is much closer to the national average level in non-resource-dependent cities than in resource-dependent cities. The results indicate that megacities and non-resource-dependent cities in the eastern region have greater advantages in terms of economic resilience and sustainability of urbanization, while other cities face the double pressure of economic transformations and outflow of inhabitants.
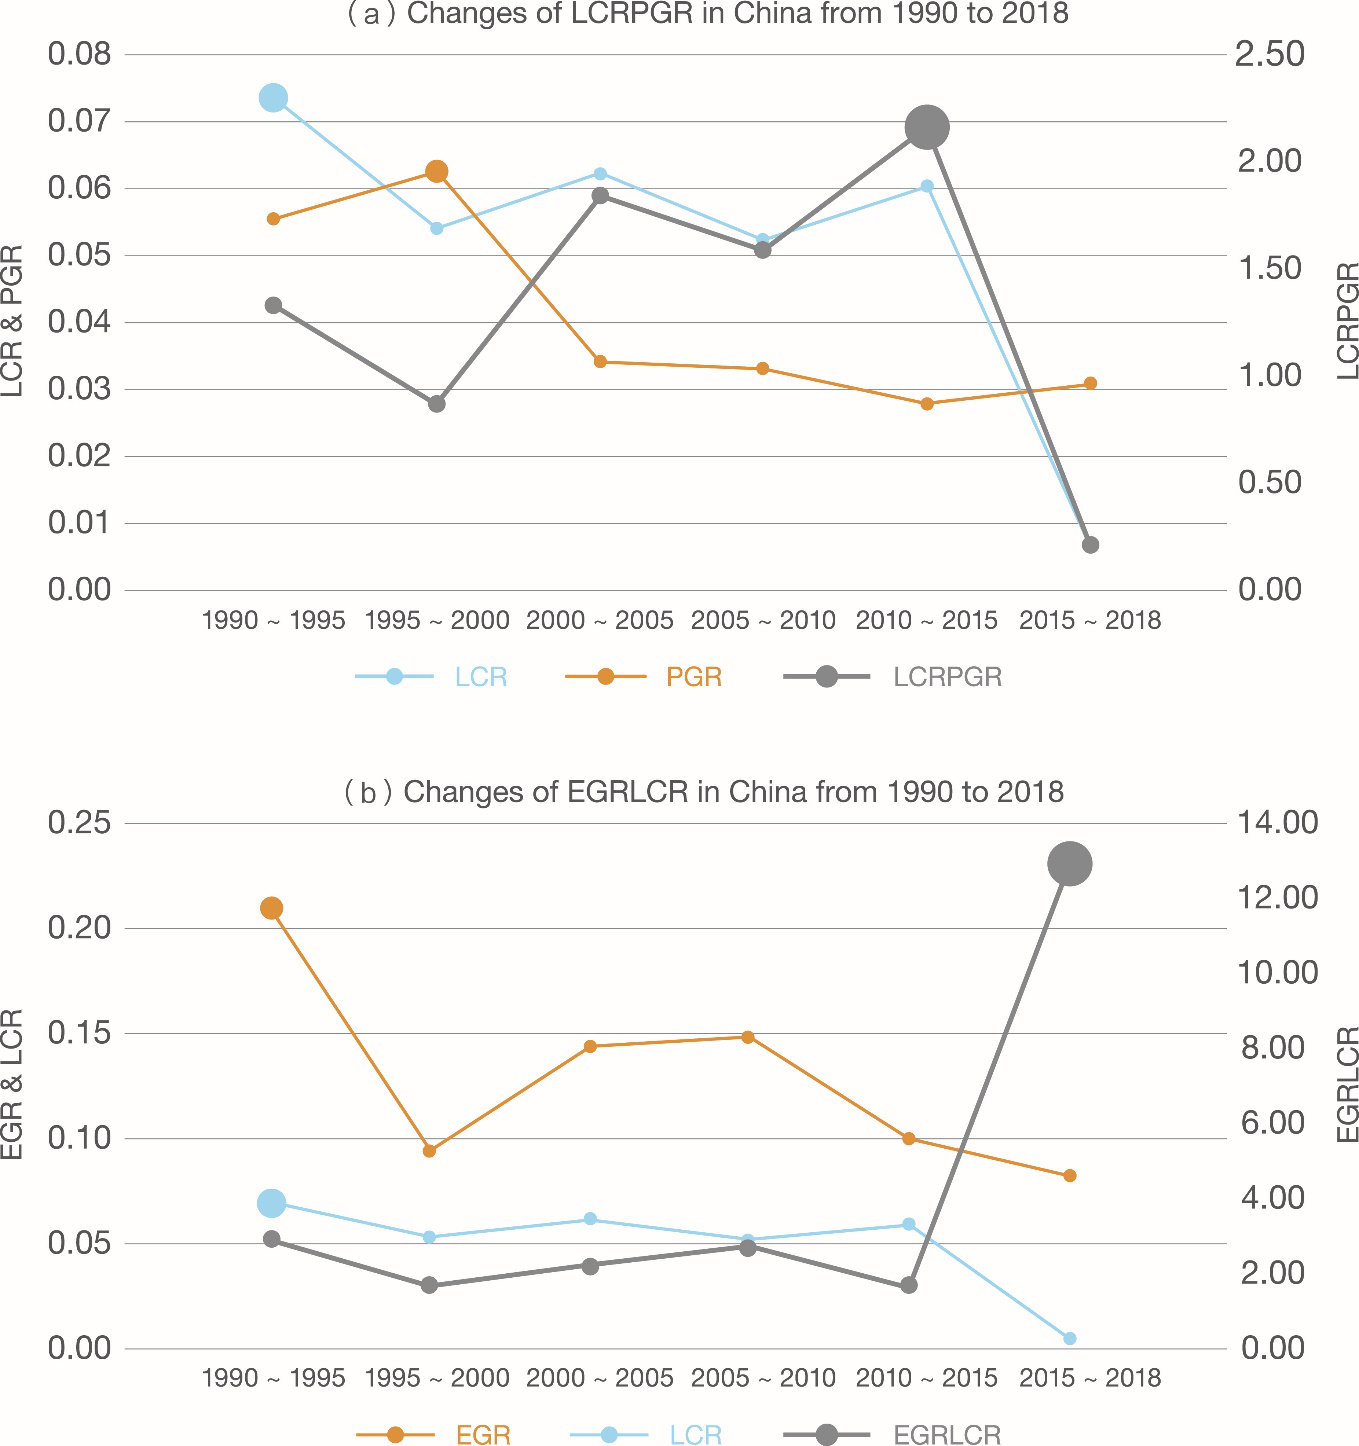
Figure 1. Changes in ratio of Land Consumption Rate to Population Growth Rate (LCRPGR) (a) and, in ratio of Economic Growth Rate to Land Consumption Rate (EGRLCR) (b) in China from 1990 to 2018
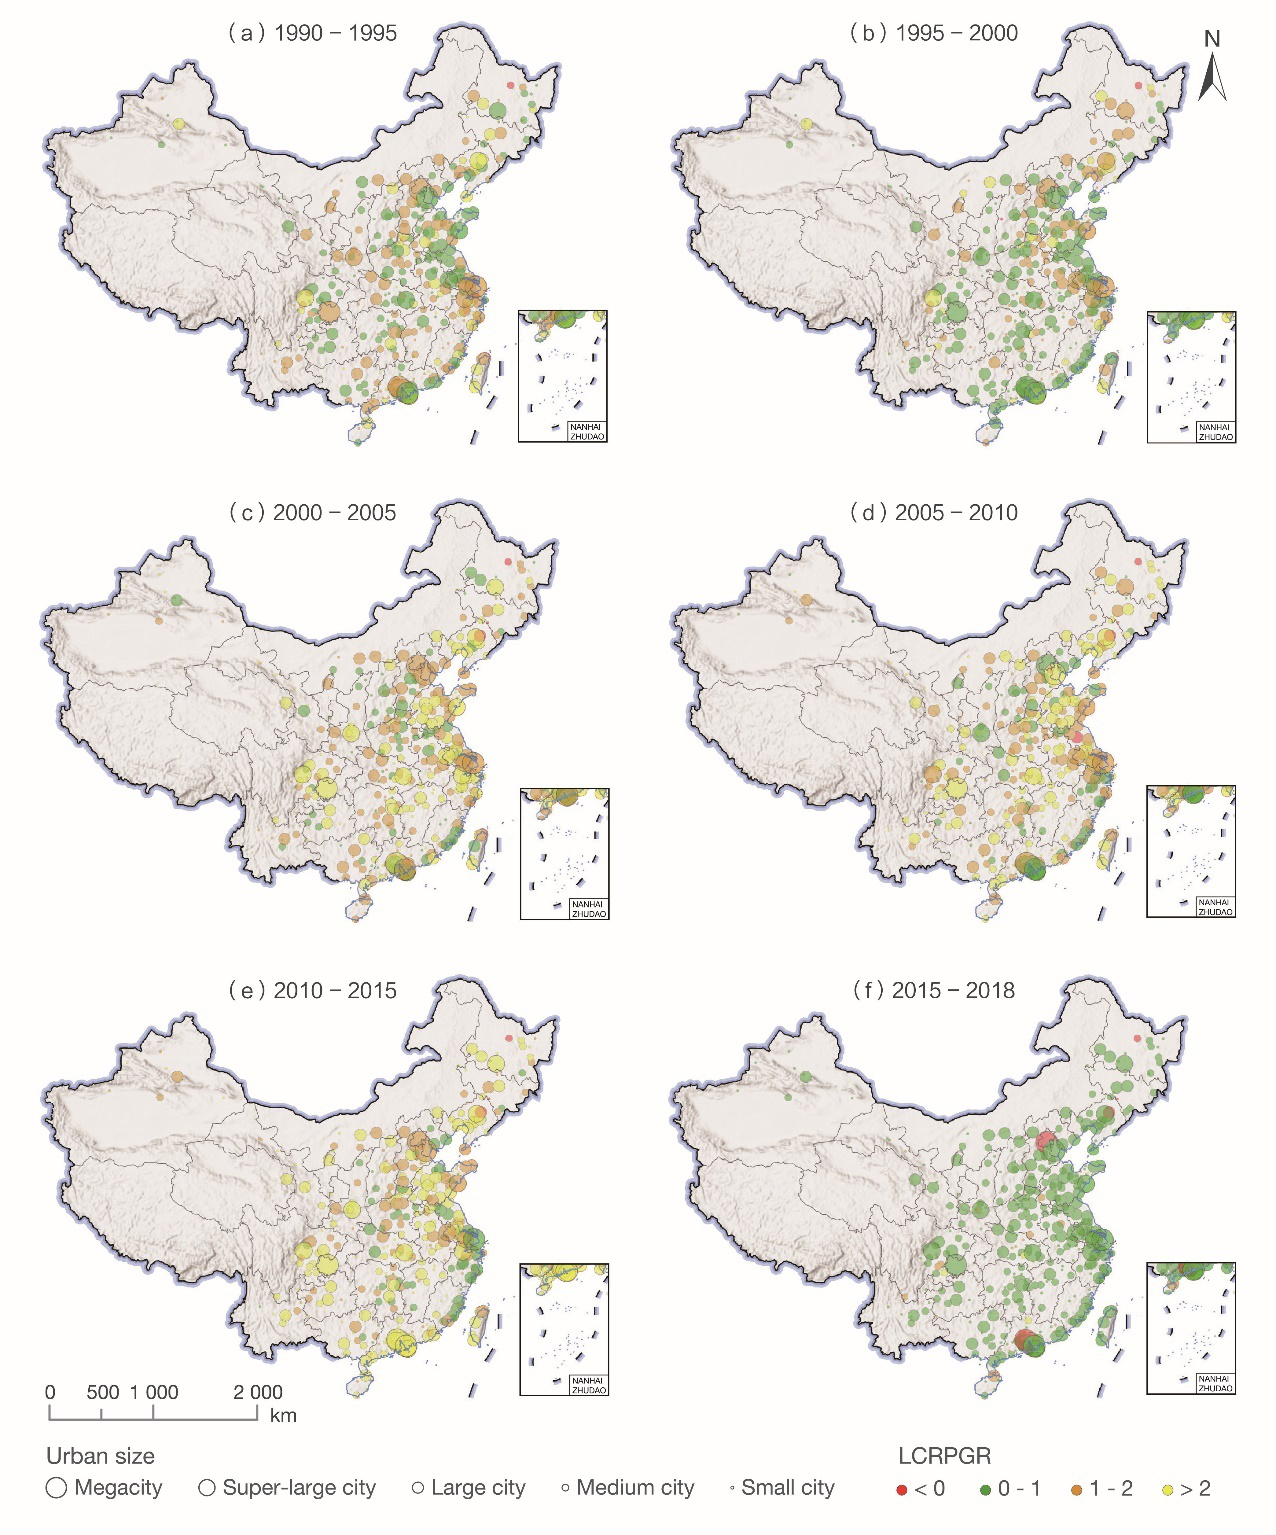
Figure 2. Spatiotemporal evolution of land use efficiency of cities in China from 1990 to 2018
Outlook
In this case, multi-sourced remote sensing data were used to map the impervious surfaces of 433 Chinese cities with a population of more than 300 000 from 1990 to 2018, and then produce a comparable dataset on changes in urban built-up areas, needed to calculate LCR. A new indicator was proposed, i.e., the ratio of Economic Growth Rate to Land Consumption Rate (EGRLCR), which coupled with LCRPGR and aided by Earth observations and census data, can evaluate the spatiotemporal evolution of urbanization in China from the economic, social and environmental perspectives. Future work will focus on combining international open data sources and our own global urban impervious surface products to better realize the spatial coupling of population and economic data in urban built-up areas, and improve the quantitative assessment of the coordination of land, population and economic dimensions, so that global level monitoring of urbanization could become possible.