SDG11: Sustainable Cities and Communities
Proportion of the population with easy access to public transportation in China(2020)
Target: 11.2 By 2030, provide access to safe, affordable, accessible and sustainable transport systems for all, improving road safety, notably by expanding public transport, with special attention to the needs of those in vulnerable situations, women, children, persons with disabilities and older persons.
| Highlights |
| High-resolution gridded population distribution data by gender and age group for 2015 and 2018 were produced to address the lack of such data under SDG 11.2.1. In 2018, the proportion of the population with easy access to public transportation in urban built-up areas was 80.56% on average in China, while the proportions in the eastern coastal region and Sichuan and Chongqing were higher than the rest of the country. Compared with 2015, 80% of Chinese cities saw higher proportions to varying degrees, while about 8% experienced slight declines. |
Background
Public transportation, an irreplaceable part of urban transportation, supports economic activities and life in cities, and is a key factor in achieving most of the SDGs, especially those related to education, food security, health, and the environment (Pojani and Stead, 2015). According to the UN-HABITAT report (2018), the global demand for public transportation generally increased between 2001 and 2014. The greatest increase in public transportation was seen in China, where multiple plans for prioritizing the development of public transportation were implemented vigorously in a top-down approach. However, it is difficult to acquire and quantify complex public transportation networks using traditional analytical methods or to accurately evaluate the degree to which public transportation development matches the pace of urbanization. This is an area where Big Earth Data can be applied (United Nations, 2015; Chen et al., 2019; Deville et al., 2014).
Data used
①Public transportation network (e.g., bus and metro networks) data in China, 2015 and 2018.
②Land use data with 100 m resolution in China, 2015 and 2018.
③1% national population sample survey data, 2015 and census data, 2010.
④Auxiliary data including Visible Infrared Imaging Radiometer Suite Day/Night Band (VIIRS/DNB) night-light remote sensing data, mobile positioning data from Tencent, and Digital Elevation Models (DEMs), 2015 and 2018.
Method
For each administrative unit, the resident population, gender ratio, and proportion of each age group (0-14, 15-64, ≥65 years old) were extracted from the population sample survey and census data. The population was redistributed into the 1 km grid using a spatial downscaling model. Then the grid was superimposed on the rasterized gender ratio and the proportion of each age group to obtain the population distribution by gender and age group.
Next, public transportation stations (e.g., bus and metro stations) with spatial attributes were extracted from China's public transportation network data, and a 500 m buffer zone was created for each station. This buffer layer was superimposed on the above-mentioned gridded population data to calculate the population within the buffers.
Finally, these layers were first superimposed on the spatial data of urban areas extracted from land-use data and then aggregated from the grid level to the prefectural and provincial levels to calculate the proportion of the population with easy access to public transportation within the built-up area.
Results and analysis
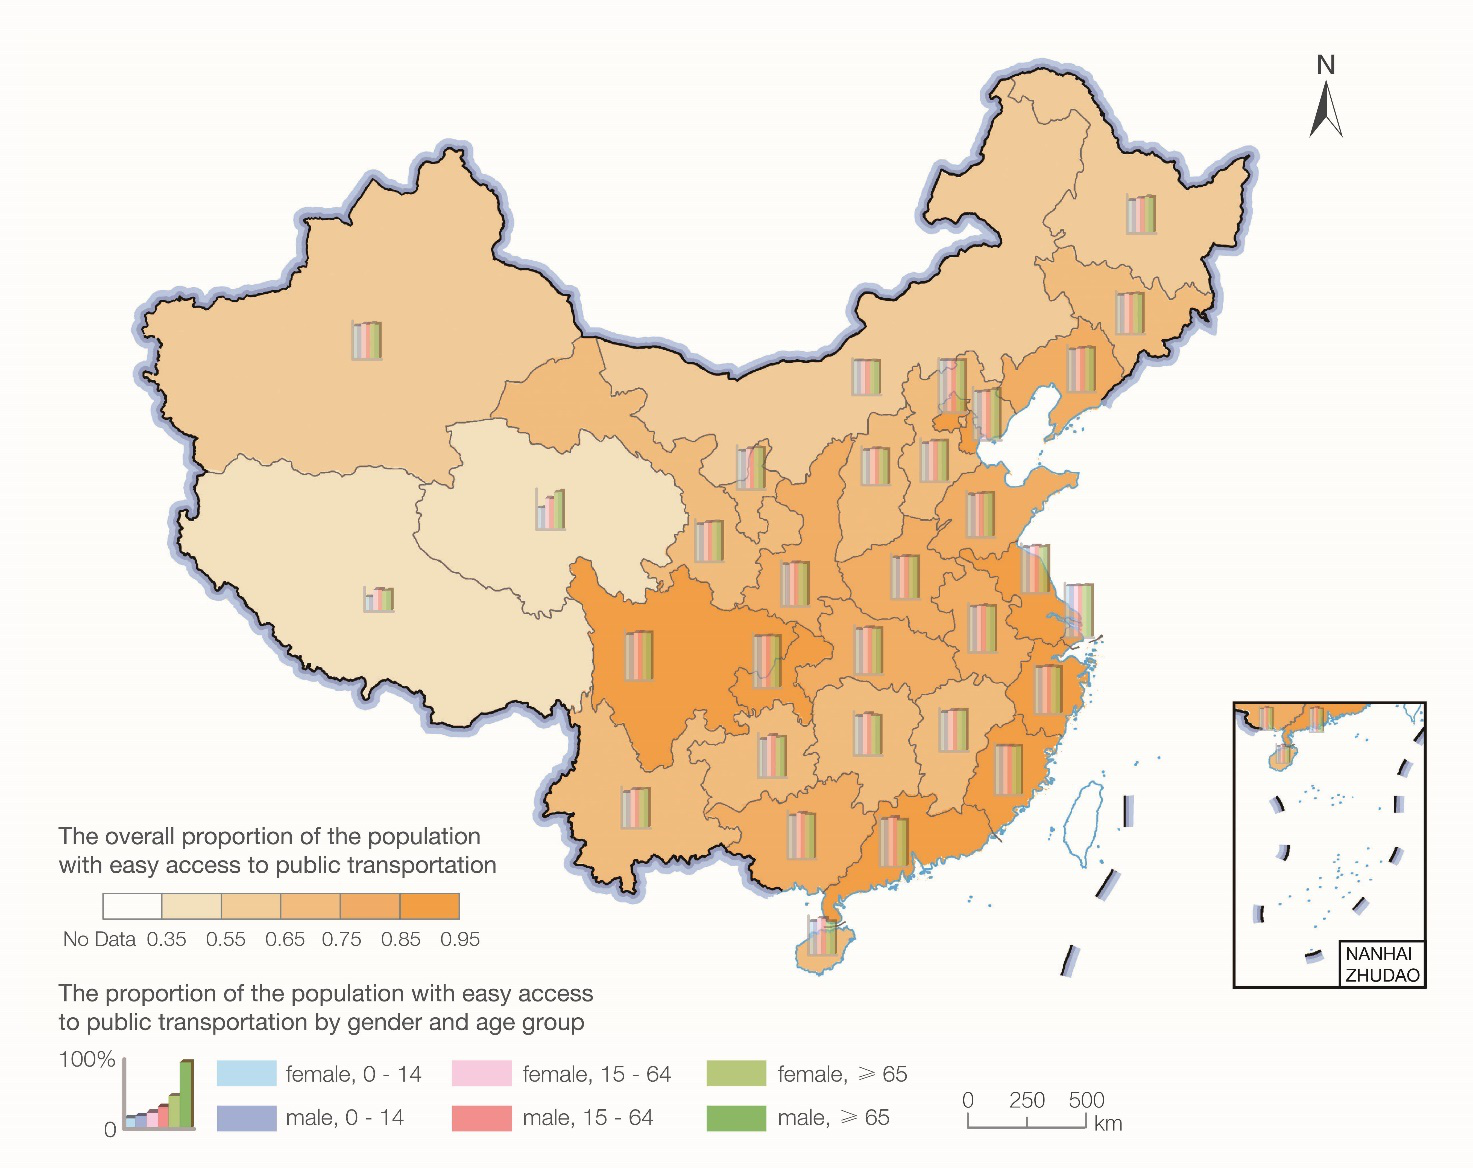
The distribution of SDG 11.2.1 at the provincial level in 2018 is shown in Figure 1. The population with easy access to public transportation at the provincial/municipality level was 80.56% on average in 2018, with the proportions in the eastern coastal region and Sichuan and Chongqing generally higher than those in the rest of the country. Chongqing, Beijing, and Shanghai had the highest proportions in China of over 90%, while Tianjin, Sichuan, and eastern provinces Guangdong, Fujian, Zhejiang, and Jiangsu followed closely behind at 85%, and Qinghai and Tibet had the lowest proportions.
In terms of gender, there was little difference across provinces. In terms of age groups, all except Qinghai and Tibet had a relatively balanced distribution with only minor differences. In southern China, including Guizhou, Hunan, and Guangdong provinces, the 15-64 age group was 4-6% higher than other age groups. In the northern and western regions, such as Heilongjiang, Liaoning, Shanxi, Gansu, Hebei, Sichuan, and Yunnan provinces, the proportions in the 15-64 and ≥65 age groups were similar, but that for the 0-14 age group was, on average, 2-4% lower than the other two groups.

Figure 1. SDG11.2.1 at provincial-level by gender and age group
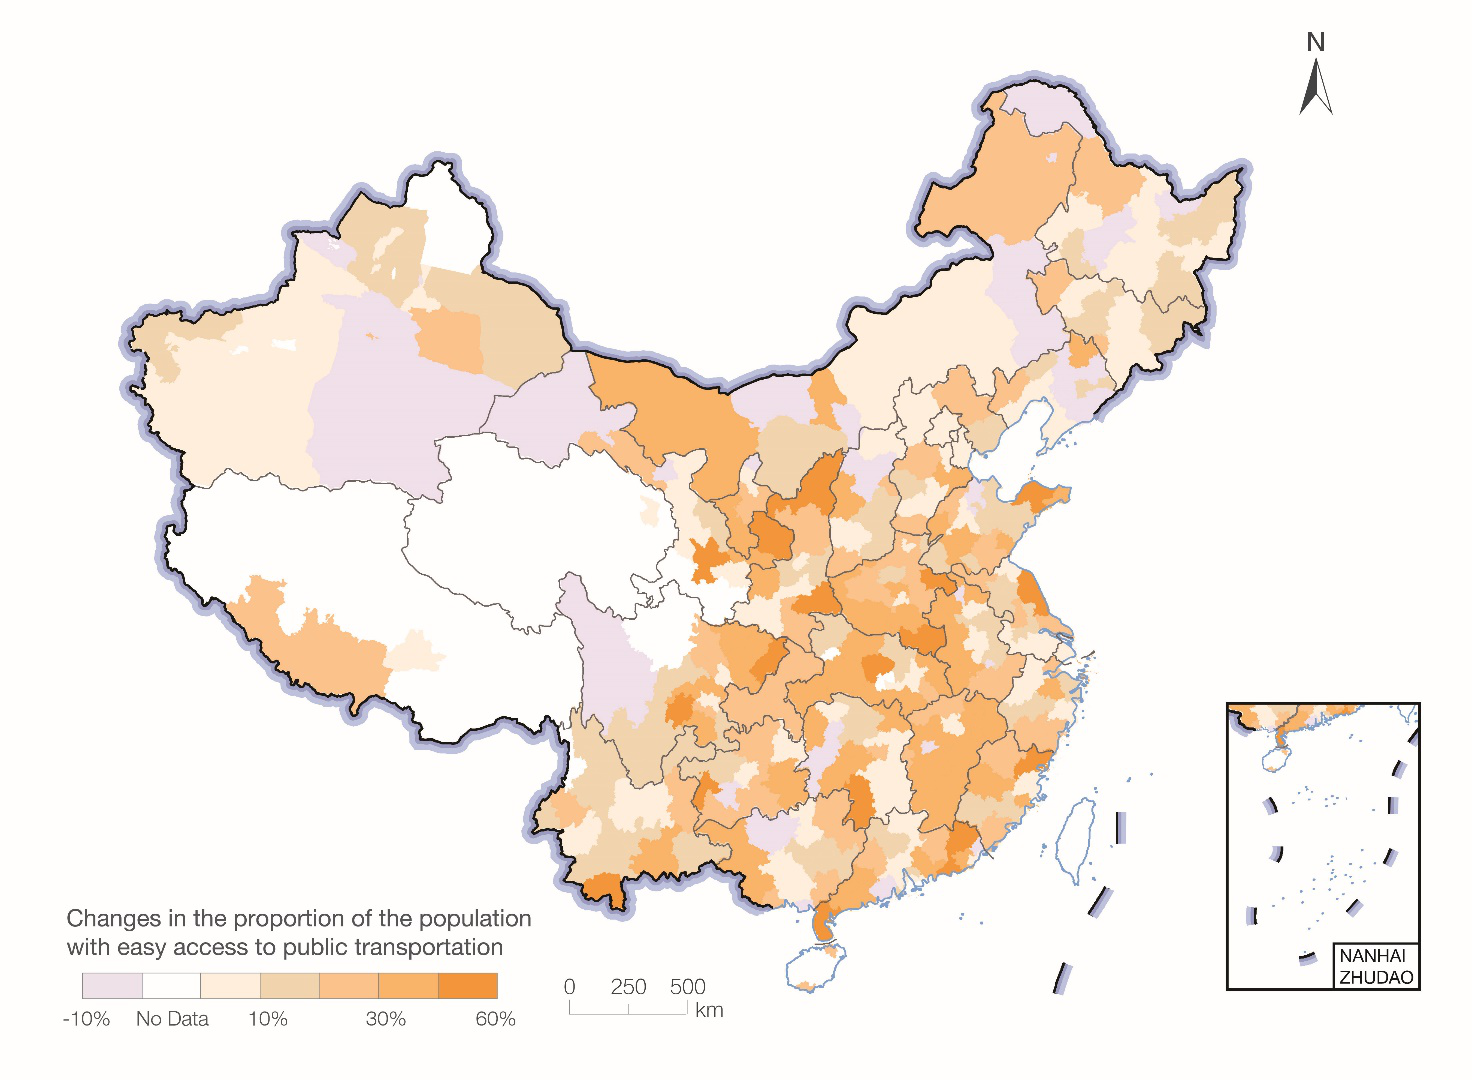
Considering the distribution changes at the prefectural level from 2015 to 2018 (Fig. 2), the SDG 11.2.1 indicator increased in about 80% of the cities, with densely-populated cities with weak public transportation infrastructure in the past growing the fastest, and provincial capitals and economically advanced cities growing less because of their existing good public transportation. The indicator dropped slightly in about 8% of the cities where public transportation lagged behind the urban expansion.

Figure 2. Variations of SDG 11.2.1 at prefectural-level from 2015 to 2018
Outlook
This case study used Big Earth Data that included public transportation networks and high-resolution gridded population data to estimate the distribution in China, by gender and age group, of the population with easy access to public transportation, on a grid-scale, in 2015 and 2018. The comparison and detection of variations for indicator SDG 11.2.1 were realized at the prefectural and provincial levels. The methodology this case used is easy to apply with data easy to collect and update, and it can serve as a new approach to national evaluations and international comparisons of SDG 11.2.1.

