SDG11: Sustainable Cities and Communities
Estimates of population living in shantytowns as a percentage of main urban district residents in cities in China(2020)
Target: 11.1 By 2030, ensure access for all to adequate, safe and affordable housing and basic services and upgrade slums.
| Highlights |
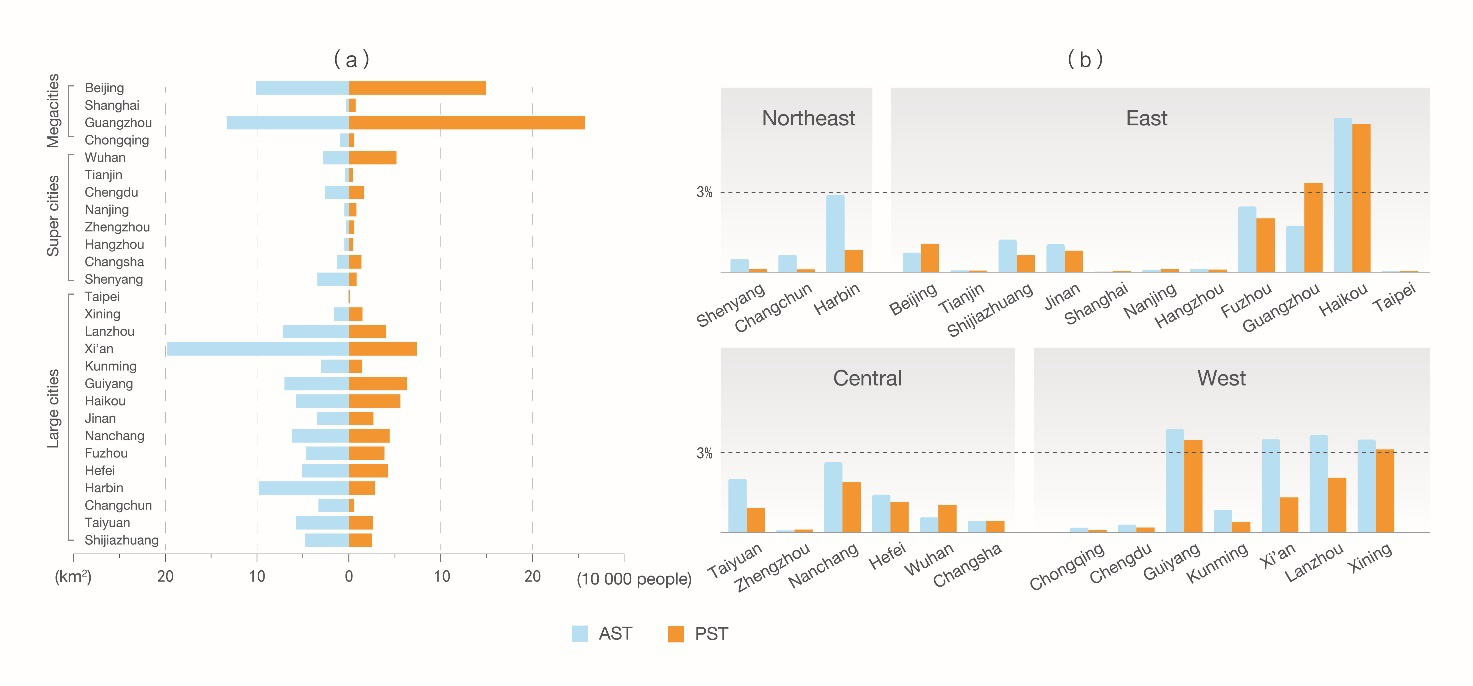
| The spatial boundaries of shantytowns in the main urban districts of 27 Chinese cities as of 2019 were identified and extracted for the first time by adopting high-resolution satellite images from Gaofen-2 (GF-2) and advanced semantic segmentation models. Shantytowns in 27 cities covered an area of 124.49 km2 with a total population of 1.032 million in 2019. There were significant differences between Eastern and Western cities in the ratios of area and population of shantytowns to those of main urban districts. The proportion of Population in Shantytowns (PST) was above 3% in Guangzhou and Haikou, while the percentage of Area of Shantytowns (AST) was higher than 3% in Xi'an, Lanzhou, and Xining. These cities are under great pressure for urgent and orderly shantytown redevelopment. |
Background
Rapid urbanization is accompanied by the increase in shantytown dwellers, inadequate housing, and the excessive burden on urban infrastructure. In 2018, nearly 23.50% of the global urban population lived in shantytowns. COVID-19 in particular has dealt a heavy blow to the public health of more than one billion shantytown dwellers worldwide (Sachs et al., 2020). Improving the living conditions of shantytowns has been widely recognized as one of the primary challenges for sustainable urban development in the coming decades. Based on this, SDG 11.1.1 "proportion of population living in slums or informal settlements" is a key indicator in urban sustainability assessment (United Nations, 2015). There are, however, no explicit definitions or standards for informal settlements, slums and shantytowns in the world (Wurm et al., 2019). The shantytowns in China are hugely different from the slums in Brazil, India, and Africa in terms of infrastructure supply, population density, fire safety standards, and public health conditions. The Notice on Accelerating the Transformation of Shantytowns (Dangerous and Old Houses) issued by 7 Chinese government ministries including the Ministry of Housing and Urban-Rural Development, the National Development and Reform Commission, and the Ministry of Finance defines shantytowns (dangerous and old houses) as areas, situated within the geographical scope of urban planning, where there is a high level of concentration of old, poor, simple-structure homes in great density with building safety concerns, incomplete functions, and inadequate infrastructure. Combining the above definition with the United Nations' standards of informal settlements, and in light of the features observed from the high-resolution satellite images, this study defines shantytowns as continuous areas, situated within the geographical scope of urban planning, where most homes are old, of low building height but in high density, roads are often irregular or dead-end, and necessary facilities are lacking.
Currently, there are no datasets on the area and population of informal settlements in China. To promote sustainable urban development, it is urgently needed to develop a shantytown monitoring and assessment indicators system consistent with SDG 11.1.1 based on Big Earth Data.
Data used
①GF-2 panchromatic fusion image (0.8 m) in 2019.
②Essential urban land use categories in China (EULUC-China).
③World Population (WorldPop) data (100 m) in 2019.
④The 6th census data (2010) of China.
Method
In conformity with SDG 11.1.1, a multi-scale shantytown identification scheme based on high-resolution satellite images (GF-2) was developed for the extraction of the spatial boundaries of shantytowns through the Deeplab V3 + semantic segmentation model. First, the proportions of cultivated land, towns, and human settlements were calculated based on EULUC-China vector data, and then the scope of main urban districts were determined (by the threshold of cultivated land being less than 0.01). Meanwhile, sufficient samples were collected through visual selection from GF-2 fusion images of 27 cities. Second, shantytowns in these cities were mapped by adopting semantic segmentation models and transfer learning. Finally, the Populations in Main Urban Districts (PMUD) and shantytowns were estimated by using WorldPop data, and then the Proportion of PST (PPST) was calculated as follows:
Results and analysis
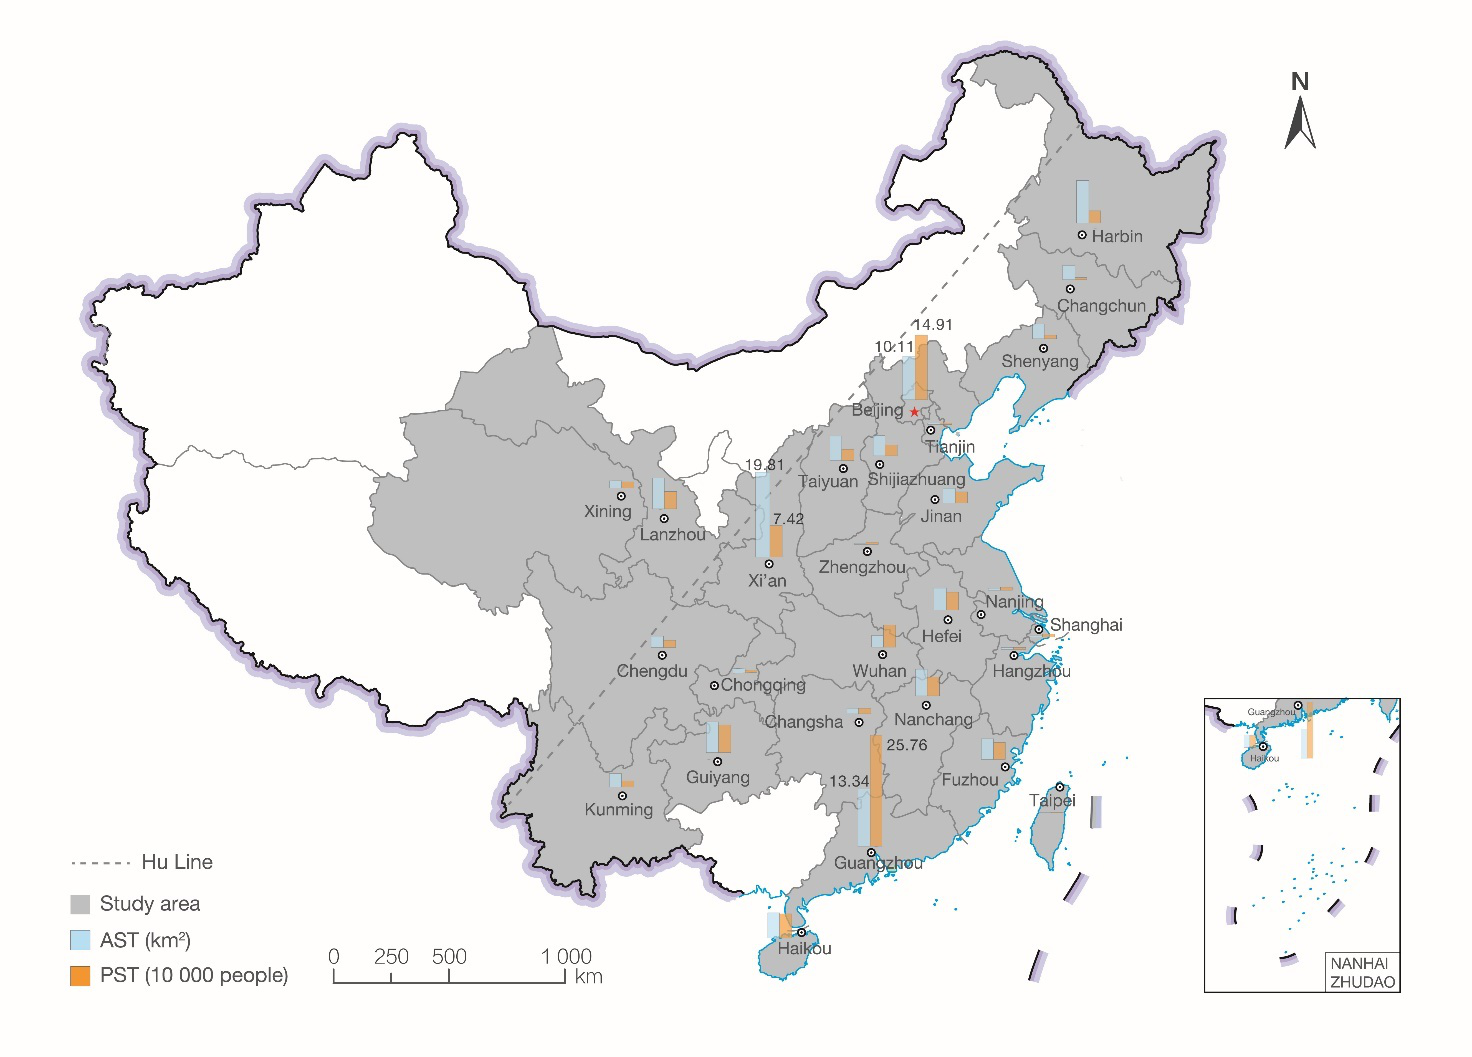
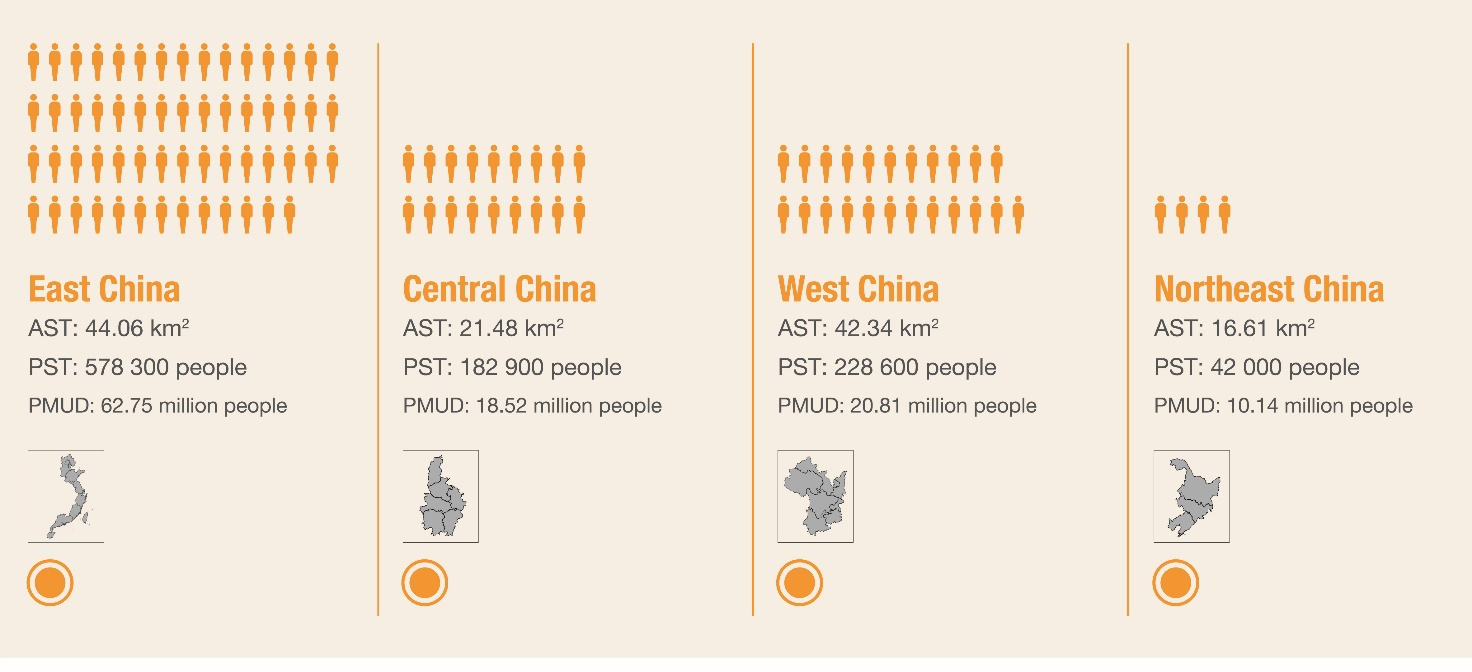
Shantytowns in the main urban districts of the 27 Chinese cities covered an area of 124.49 km2 with a total population of 1.032 million in 2019 (Fig. 1). There were significant differences among China's four economic regions (East, Central, West, and Northeast China) in the proportions of AST and PST to those of main urban districts. Specifically, East China had the largest shantytown areas of 44.06 km2 and 578 300 dwellers. West China ranked second, with 42.34 km2 in area and 228 600 dwellers. The shantytowns in Central China covered an area of 21.48 km2 with 182 900 dwellers, while those in Northeast China were 16.61 km2 and had 42 000 people.
The shantytowns existed due to several factors (Fig. 2). Guangzhou had the largest number of shantytown dwellers (257 600 people) due to the influx of migrant workers and other migrants. In Xi'an, shantytowns scattered around the city, resulting in its AST as large as 19.81 km2. Haikou's PST was about 6% due to the weak infrastructure in the old city and unbalanced urban development. In Harbin, which was traditionally an industrial city, the complexity of building types made more difficult the redevelopment of shantytowns, which accounted for about 2.5% of the main urban districts.

Figure 1. Difference in AST and PST in 27 major cities of China, 2019


Figure 2 The AST and PST (a) and their shares in different regions (b)
Outlook
Based on high-resolution satellite images and population raster data, the AST and PST in 27 cities across the four economic regions in China in 2019 were estimated by adopting semantic segmentation and transfer learning methods. The study produced rapid and accurate estimates, demonstrating a reliable methodology for estimating population living in slums or informal settlements in other countries, in support of achieving SDG 11.1.1.

