
SDG11: Sustainable Cities and Communities
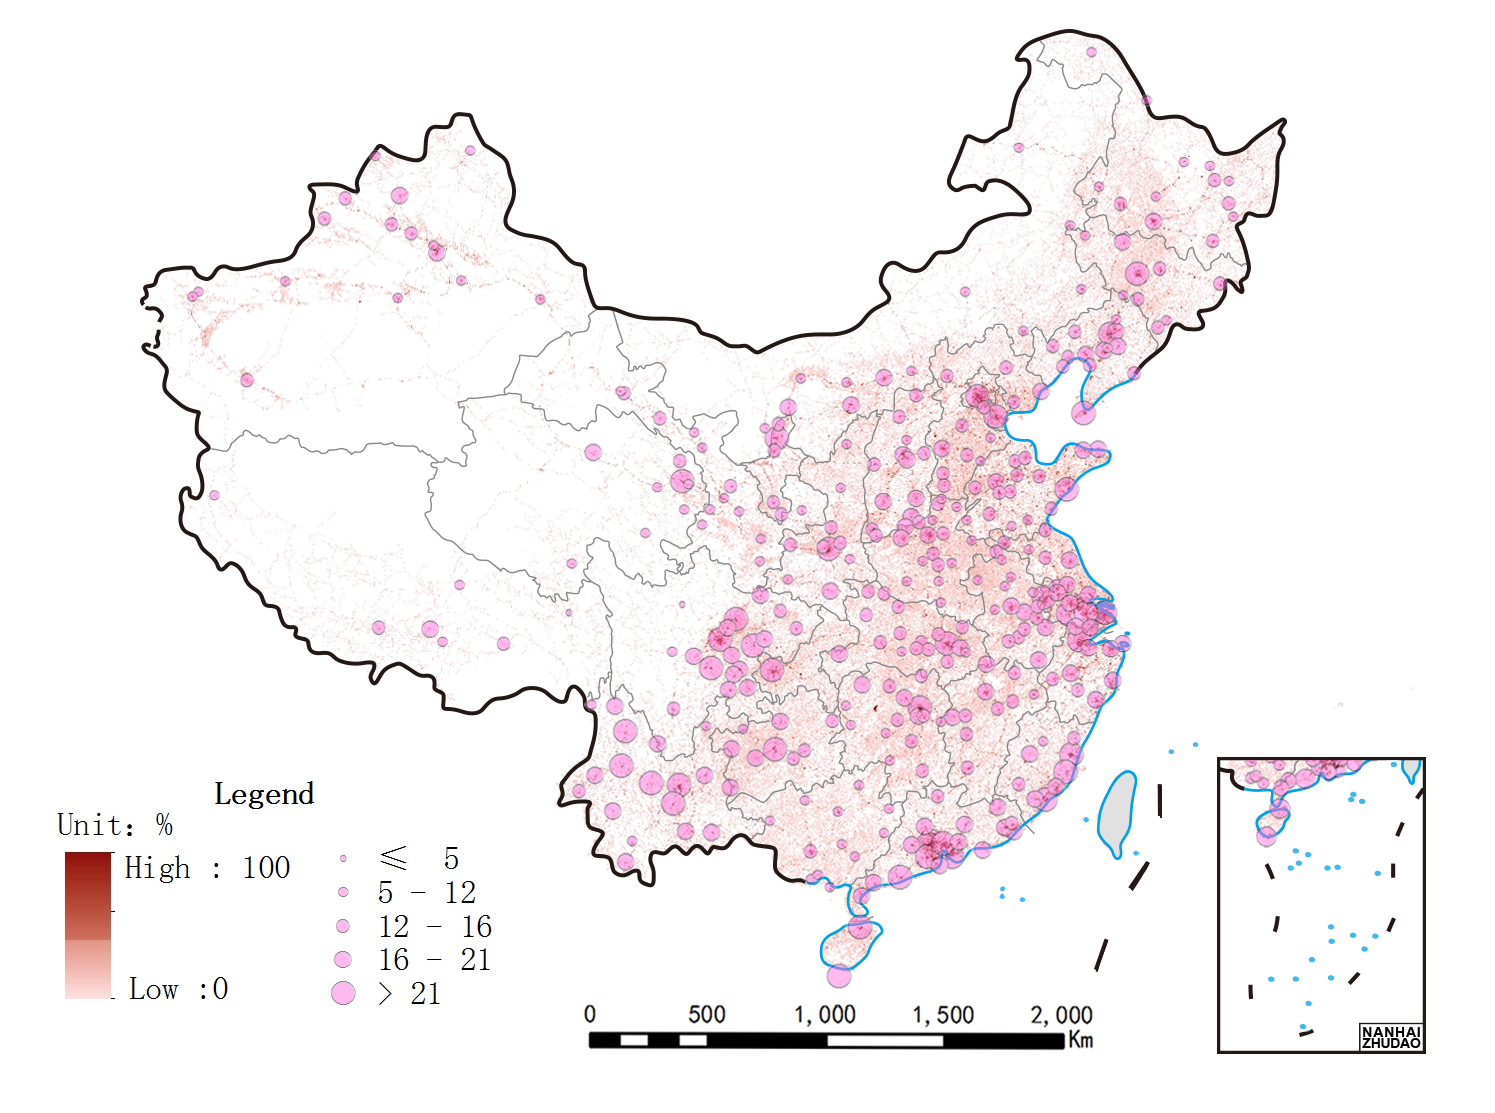
Proportion of urban open public space in China(2019)
Scale: National

Study area: China
Open public spaces provide valuable services such as entertainment opportunities, aesthetic enjoyment, and environmental and agricultural functions for urban residents. These spaces serve as a prerequisite for improving city functions, promoting health, and developing efficient urban ecosystems with better quality of life for residents. Public space is also linked to benefits such as increased social security and cohesion, greater equality, and improved health and wellbeing. Open public spaces are the key to realizing SDG 3 (Good Health and Well-being), SDG 5 (Gender Equality), SDG 8 (Decent Work and Economic Growth), and SDG 13 (Climate Action). Urban public space planning and management provides a feasible path for urban space transformation and quality improvement.
Target 11.7: By 2030, provide comprehensive, convenient, green public space for all, especially for women, children, the elderly, and those with disabilities.
Indicator 11.7.1: Average proportion of open public space provided for all people in urban built-up areas.
Method
The “urban land” sub-category is extracted from land use data to establish the national built-up area spatial database. Open public spaces (including public green spaces and squares) are extracted from within defined urban boundaries based on built-up areas from national navigation vector data, and road data at all levels (e.g., highway, national highway, provincial highway, county road, township road, and urban streets). Road data is converted from line to polygon structures according to Chinese road width specifications. The specific calculation process is described as the following. (1) A national kilometer grid is generated and a Fishnet function is defined. The grid transformation method is then used to generate the national kilometer grid. (2) The national grid is overlapped with public green space spatial data to generate kilometer grid public green space spatial data. (3) High-speed, provincial, county, and other urban roads are converted into polygon data according to national road construction width specifications. This data is then overlapped with a national grid to generate kilometer grid road spatial data. (4) Road data and public green space data are integrated at the grid scale and divided by the total urban built- up area to determine the urban open public space area. (5) The results are converted from the kilometer grid scale to county, city, provincial, and national scales based on spatial statistical analysis.
Data used in this case
The case data includes navigation data for China acquired in 2015, which includes public green spaces, public squares, and roads at all levels (e.g., highway, national highway, provincial highway, county road, township road, and urban streets). The data was stored in a PostgreSQL database.
The case data also includes land use data for China in 2015 with a 100-meter resolution. Data was obtained from China's Land use Status Remote Sensing Monitoring Database, CAS. It is generated by visual interpretation based on Landsat 8 images.
Results and analysis
This case study evaluated the open public spaces for all prefecture-level cities in China. The preliminary conclusion from the analysis was that at the provincial level, the average proportion of open public space in the built-up areas of Chinese cities was 17.98% (excluding Hong Kong, Macao, and Taiwan province). Beijing featured the highest proportion of open public spaces (29.18%), while Guangxi had the lowest percentage (10.82%). A total of 18 provinces, including Qinghai, Shaanxi,Guizhou, Shanxi, Jiangxi, Jilin, Hubei, Hunan, and Shandong, had a lower amount of open public space areas compared to the national average. At the city level, the proportion of open public spaces in the eastern cities was higher than in the central and western cities. Moreover, provincial capitals had higher proportions of open spaces compared to other cities in the province. The proportion of open public spaces in the Beijing-Tianjin-Hebei urban agglomeration, Yangtze River Delta urban agglomeration, the Pearl River Delta urban agglomeration, Sichuan Basin urban agglomeration, and the Yunnan-Guizhou urban agglomeration were higher than in the surrounding cities. Urban open public spaces were mainly composed of parks, squares, green spaces, and other public spaces and roads. The largest urban open spaces based on the density of urban roads were found in the Beijing- Tianjin-Hebei urban agglomeration, Yangtze River Delta urban agglomeration, and the Pearl River Delta the Sichuan Basin urban agglomeration and the Yunnan-Guizhou urban agglomeration. Green public spaces were mostly found in urban agglomeration.
Figure 1. Proportion of open public space in major prefecture-level cities in China.
Figure 2. Proportion of urban open public spaces for different provinces.
| Highlights |
| At the provincial level, the average proportion of open public spaces in the built-up areas of Chinese cities was 17.98% (excluding Hong Kong, Macao, and Taiwan province). Beijing had the highest proportion of open public space (29.18%), while Guangxi had the lowest proportion (10.82%). At the city level, the proportion of open public space in eastern cities was higher than in the central and western cities. Moreover, the provincial capitals had a higher proportion of open space than other cities in the province. |
Outlook
The navigation data for China can be updated in real time, and land use products are updated every 3-5 years. This is enough to meet the requirements for future high temporal resolution evaluation.
The method adopted in this case is simple, and navigation and land use data are relatively easy to obtain. This enables the methodology to be easily reproducible in other countries and allows for international comparison.
The open space described in this study does not consider diverse categories of open space, and this needs to be addressed in the future.
It is still challenging to classify information based on gender, age, disability, and other demographic characteristics. The next step is to develop spatial data products for population based on different groups utilizing big data such as mobile phone platforms and Internet sources.